Statistics is the science of collecting, organizing, and analyzing data.
Data (singular: datum) refer to facts or pieces of information. Some examples of data are:
| Example Data |
|---|
|
The ages of the students in your statistics class: 19, 21, 18, 18, 34, 30, 25, 26, 24, 24, 19, 18, 21, 49, 27 The genders of the last eight people to walk by: male, male, female, male, female, female, female, male The IQ (Intelligence Quotient measurement) of five randomly selected individuals: 109, 89, 129, 101, 104 |
Most types of statistics are either Descriptive or Inferential.
| Descriptive Statistics |
|---|
|
Descriptive Statistics consists of organizing and summarizing data. |
| Inferential Statistics |
|---|
|
Interfential Statistics consists of using data youíve collected to form conclusions. |
Here's a sample question: Letís say there are 20 statistics classes at your university, and youíve collected the ages of all the students in one class.
Ages of students in your statistics class: 19, 21, 18, 18, 34, 30, 25, 26, 24, 24, 19, 18, 21, 49, 27A descriptive question that could be asked about this data is "What is the most common age of student in your statistics class?" The answer in this case would be 18. An inferential question that could be asked about this data is "Are the ages of the students in this classroom similar to what you would expect in a normal statistics class at this university?"
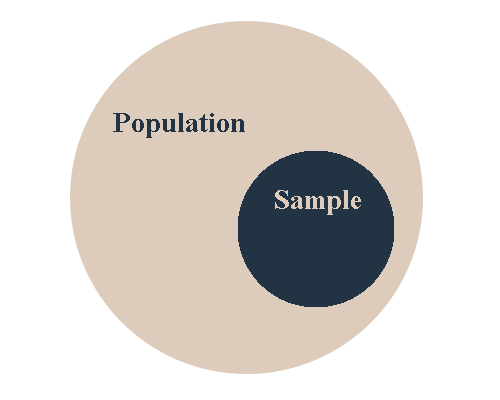
In statistics, we deal with populations and samples.
| Population |
|---|
|
The population is the entire group you are interested in studying. |
| Sample |
|---|
|
A sample is a subset of the population. That is to say, it is a select group of information taken from a population. |
Letís say you want to find the average GPA of a student at your university. Your university has 20,000 students, and you randomly select 100 students and ask them their GPAs. Your population is the group youíre interested in studying (the 20,000 students), and your sample is a small group (a subset) youíve taken from the population.

|
Figure 1. |
|---|