| Histogram |
|---|
|
A histogram is a bar graph that lists each measured category on the horizontal axis and the number of occurrences for each category on the vertical axis. The rectangles for each bar touch one another. |
| Discrete Histogram |
|---|
|
Discrete histograms are created when dealing with discrete values on the horizontal axis. |
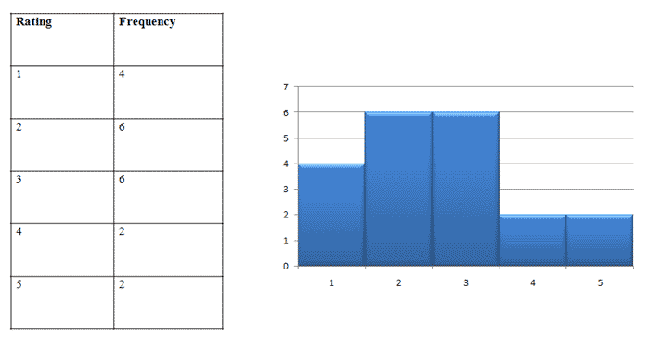
For example, say you ask 20 people to sample a new flavor of candy, then indicate how much they liked it on a scale from 1 to 5 (with 5 being "very tasty" and 1 being "tastes horrible"). You obtain the following results:
3, 1, 3, 2, 2, 1, 2, 3, 2, 2, 5, 5, 2, 3, 3, 4, 4, 1, 1, 3
To create a discrete histogram, first create a frequency table. Then, create a discrete histogram.

|
Figure 1. |
|---|
| Continuous Histogram |
|---|
|
Continuous histograms are created when dealing with continuous values on the horizontal axis. |
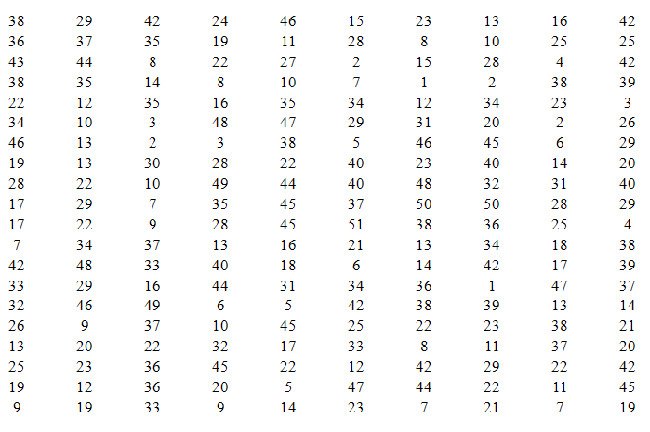
For example, say you light 200 matches and record how many seconds each match burns for until it goes out. Below is a table of your (hypothetical) results:

|
Figure 2. |
|---|
Because there are no distinct categories, we must first create classes.
| Class |
|---|
|
A class is an interval of many values. |
For example, 1-10 is a class that covers all numbers from 1 to 10.
| Lower Class Limit |
|---|
|
The lowest class limit is the smallest value within each class. |
| Upper Class Limit |
|---|
|
The upper class limit is the largest value within each class. |
| Class Width |
|---|
|
The class width is the difference between consecutive lower class limits. |
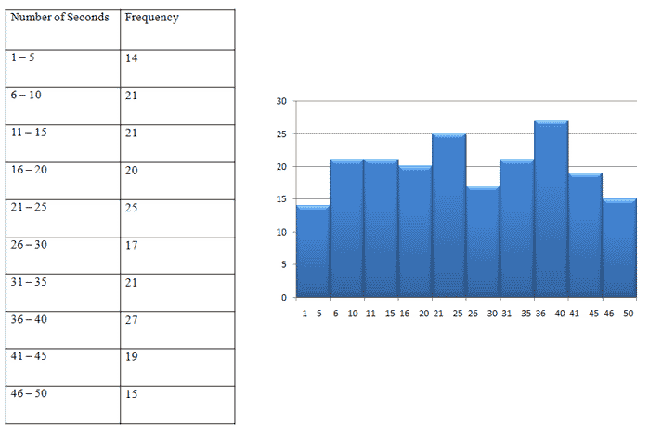
How many classes should we create for the data in the previous table? Usually, it's good to create about 8 to 10 classes.
Here's what the frequency table and continuous histogram of our data might look like:

|
Figure 3. |
|---|
| Stem-and-Leaf Plot |
|---|
|
A stem-and-leaf plot is another graphical representation of data, this time using stems and leaves. |
Imagine Iíve recorded rainfall (in inches) for the last 20 days, as shown in the table below:

|
Figure 4. |
|---|
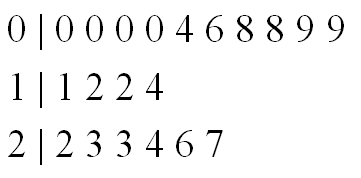
A stem-and-leaf plot for the above data would look like this:

|
Figure 5. |
|---|
The numbers on the left are the stems, while the numbers on the right are the leaves.